Categories
Lernvideos Material

Von der Mikrowelle zum Radarbild
– Farblose Fernerkundung aus dem
Weltraum

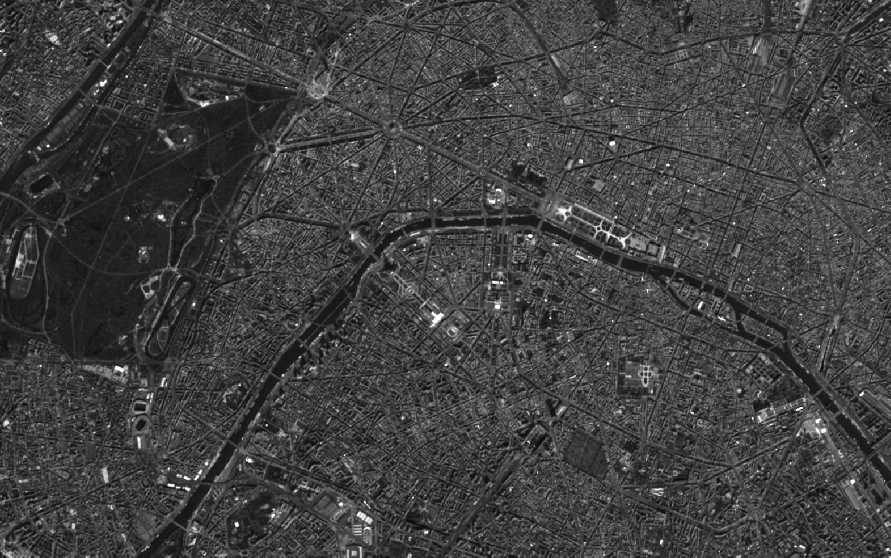
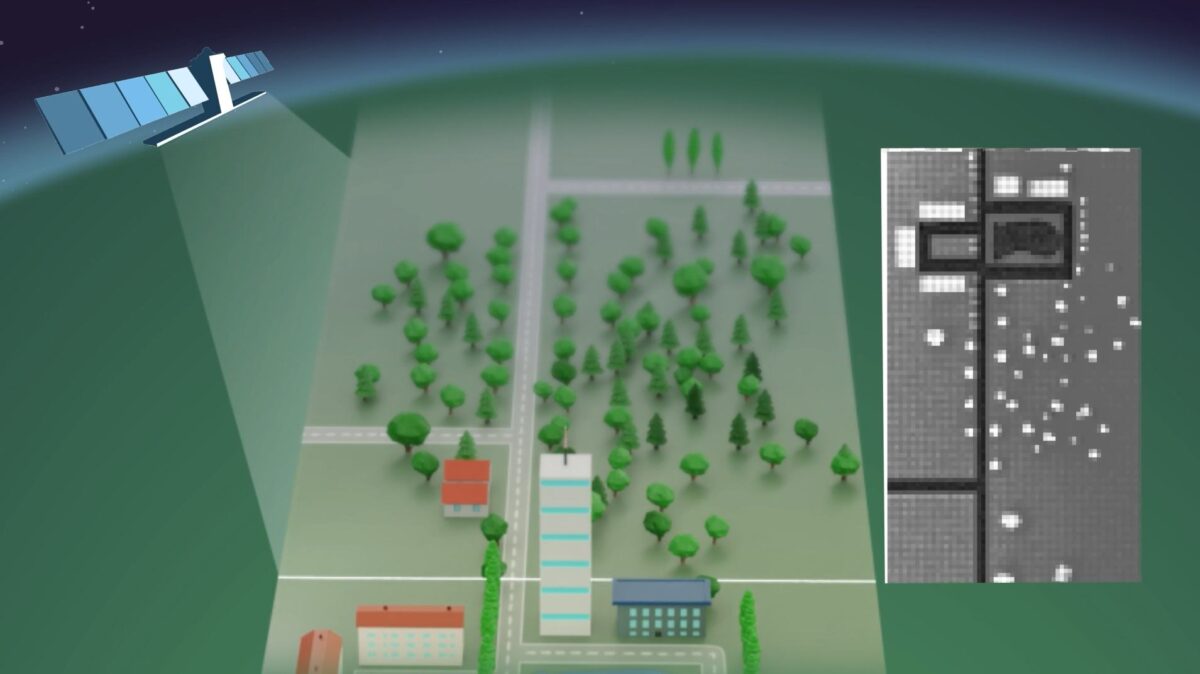
Mikrowellen sind nicht nur praktische viereckige Geräte auf dem Küchenschrank, die das Mittagessen von gestern aufwärmen, sondern sie sind auch wertvolle Informationslieferanten für die Erdbeobachtung. Gemeint sind aber natürlich nur die namensgebenden elektromagnetischen Wellen. Radarsatelliten senden langwellige Mikrowellenimpulse vom Weltall aus auf die Erde und empfangen die von Objekten reflektierten Mikrowellen. Aber wie wird dieses Echo am Ende eigentlich zu einem Bild? Und überhaupt: Ein Blick auf das elektromagnetische Spektrum zeigt uns: Wichtige Eigenschaften wie Farben, Temperaturen oder Pflanzenaktivitäten sind im Mikrowellenbereich gar nicht messbar. Also was messen Radarsensoren überhaupt?
Von der Mikrowelle zum Radarbild
Categories
Fach Geographie Klasse Klasse 5 Legacy Material

Vom Satellitenbild zur Karte

Als Grundlage der räumlichen Orientierung spielen Karten eine wesentliche Rolle im täglichen Leben und im Geographieunterricht. Während sie meist als gebrauchsfertiges Arbeitsmittel vorgegeben sind, steht in dieser Unterrichtseinheit die Entstehung einer Karte im Mittelpunkt: Aus einem Satellitenbild entwickeln die Schülerinnen und Schüler eine thematische Karte. Dabei werden Flächen am Rechner mithilfe von Reglern entsprechend ihrer Farbeigenschaft klassifiziert.

Klassen: 5

Bearbeitungszeit: 1-2 Stunden

Niveau: leicht 

Themen: Klassifikation, Landnutzungbedeckung, Thematische Karte

Autoren: Roland Goetzke, Henryk Hodam, Kerstin Voß

Ziele:

  • Die Draufsicht von Objekten soll gedeutet werden können.
  • Satellitenbilder lesen und interpretieren.
  • Räumliche Orientierung mit Hilfe von Satellitenbildern und Karten.
  • Erstellung eines Klassifikationsschlüssels.
  • Ableitung von thematischen Karten aus Satellitenbildern.
Categories
Geographie Klasse 7 Klasse 8 Lernvideos Physik

Das elektromagnetische Spektrum
– Einführung

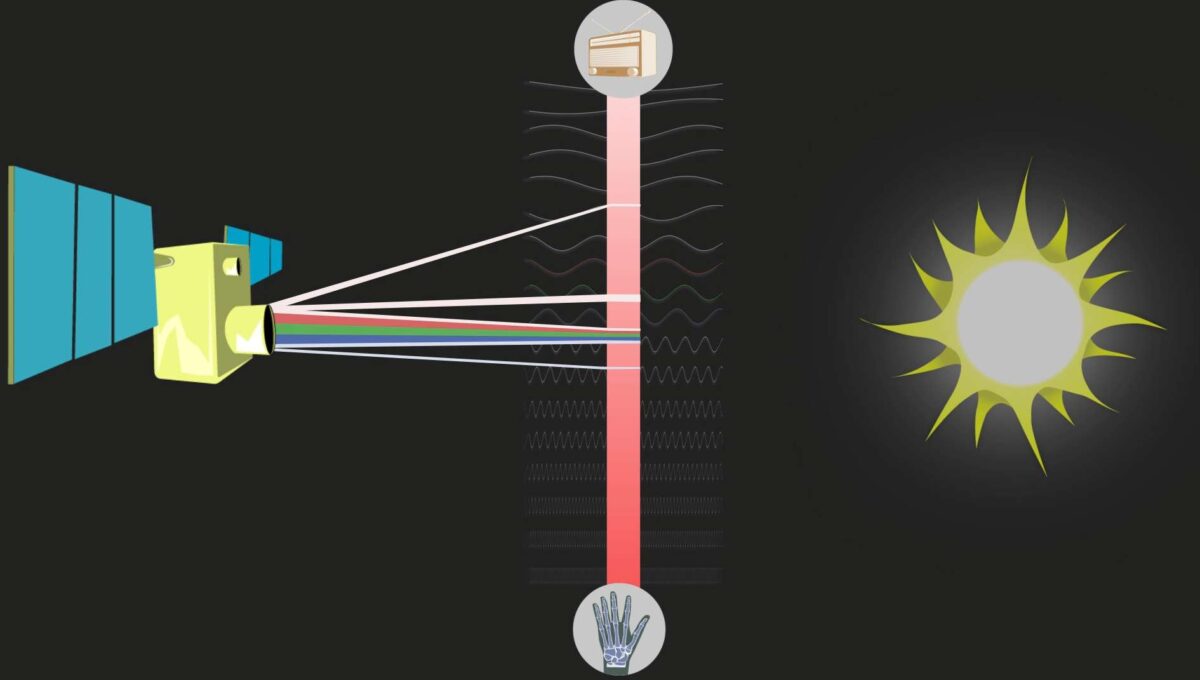
Satelliten können Merkmale unserer Umwelt aufzeichnen, die uns Menschen verborgen bleiben. Doch was genau sehen sie denn, was wir nicht sehen?

Einführung in das elektromagnetische Spektrum
Categories
Klima

Klimatest

Informationen über die Lerneinheit.

I’m baby kombucha drinking vinegar flannel put a bird on it shabby chic meggings tousled waistcoat big mood tumblr kickstarter cronut forage salvia stumptown. Bodega boys church-key adaptogen narwhal celiac whatever. Man braid four dollar toast listicle, ascot everyday carry gastropub drinking vinegar slow-carb microdosing art party marfa knausgaard hella. Hell of farm-to-table direct trade polaroid put a bird on it, sriracha migas pop-up YOLO activated charcoal echo park iPhone irony portland chambray.

I’m baby kombucha drinking vinegar flannel put a bird on it shabby chic meggings tousled waistcoat big mood tumblr 

http://www.iup.uni-bremen.de/~mreuter/clim4edu_co2ts.html
Categories
Biologie Fach Geographie Klasse Klasse 10 Klasse 7 Klasse 8 Klasse 9 Legacy

Der Wald als Klimaretter!?

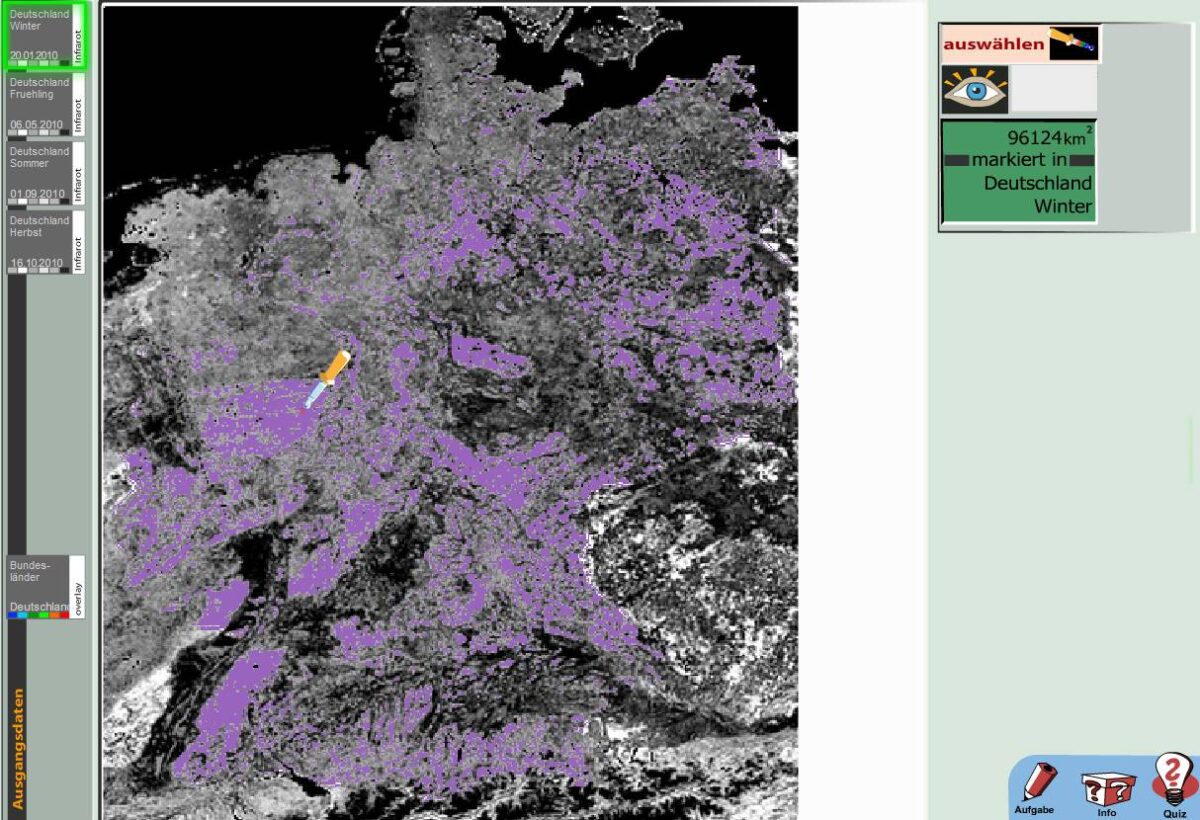
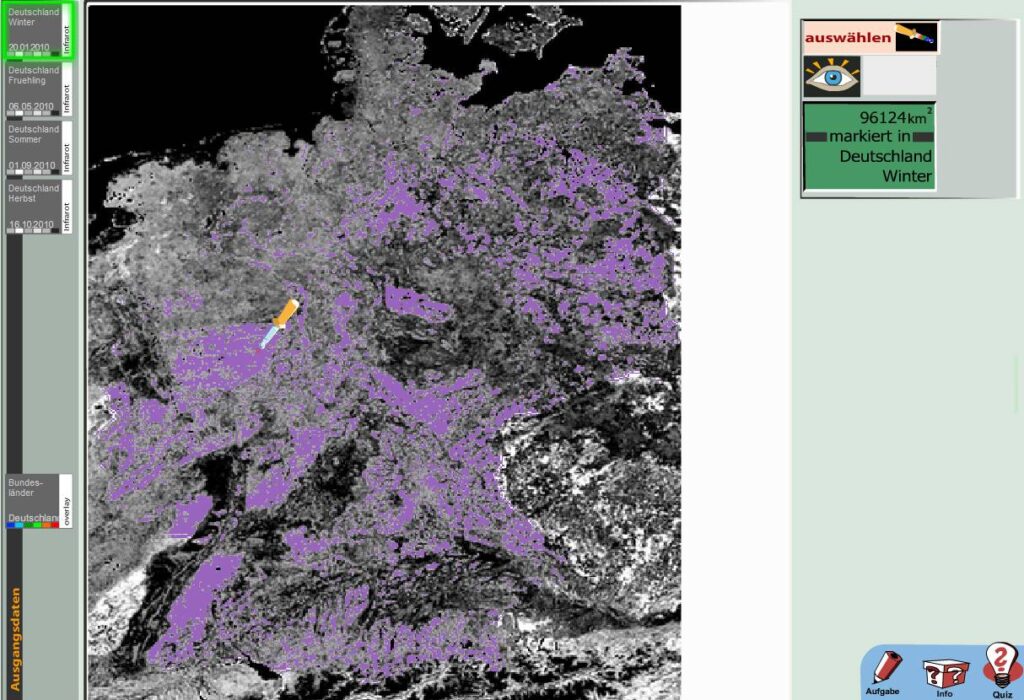
Im Zusammenhang mit den Prozessen des Klimawandels spielen natürliche CO2-Speicher als Glieder im Kohlenstoffkreislauf eine wichtige Rolle. Diese Einheit rückt den Wald als Kohlenstoffsenke in den Mittelpunkt und stellt die Frage nach der Relation in welcher die Bindung von CO2 durch Deutschlands Waldflächen zum Ausstoß des Treibhausgases innerhalb der Bundesrepublik steht. Mit Hilfe von Satellitenbildern verschaffen sich die Schülerinnen und Schüler einen Überblick über die Verteilung und das Ausmaß der Waldflächen in Deutschland. Diese Erkenntnisse werden mit Hintergrundinformationen verknüpft, um die zentrale Fragestellung beantworten zu können.

Klassen: 7,8

Bearbeitungszeit: 2 Stunden 

Niveau: leicht

Themen: Infrarot, Jahreszeiten, Klimawandel, Kohlenstoffkreislauf, Wald

Autoren: Roland Goetzke, Henryk Hodam, Kerstin Voß

Ziele:

  • Die Funktion des Waldes als CO2-Speicher soll beschrieben werden können.
  • Infrarot-Satellitenbilder sollen interpretiert werden und die Waldflächen in Deutschland darin identifiziert werden können.
  • Der Einfluss der Jahreszeiten auf die Abgrenzung von Wäldern im Satellitenbild soll beschrieben werden.
Categories
Fach Geographie Klasse Klasse 8 Lerneinheit Material Uncategorized

Südamerika

Südamerika

Ein Arbeitsauftrag

I’m baby heirloom tote bag lo-fi, thundercats flannel kinfolk plaid pug affogato occupy semiotics leggings. Biodiesel asymmetrical YOLO, ramps ethical fanny pack letterpress stumptown pop-up mixtape selvage intelligentsia austin. Echo park neutra air plant snackwave, disrupt shaman next level austin tacos biodiesel.

Böses Hochwasser

Eotools – hello from the saved content!

Voll im Blick. Das spektralste Spektrum

Repository – hello from the saved content!

H 5 P Insert – hello from the saved content!

Categories
Fach Geographie Klasse Klasse 7 Klasse 8 Lernvideos Material Physik

Bilder aus dem All

Satellitenbilder zeigen unseren Planeten aus neuen Blickwinkeln und in den ungewöhnlichsten Farben. Doch sie sehen nicht nur schön aus! Mit ihrer Hilfe werden vor allem Informationen gesammelt deren Analyse zum Verständnis des Systems Erde und des Wandels in dem es sich befindet einen unschätzbaren Beitrag leisten.
Doch wie geschieht das? Wie sehen diese stillen Beobachter, die Satelliten, aus? Welche Daten liefern sie und wie helfen sie uns dabei die hochdynamischen Prozesse auf unserem Planeten zu verstehen und zu erkennen welche Rolle der Mensch dabei spielt?

Bilder aus dem All

H 5 P Insert – hello from the saved content!

Categories
Fach Geographie Klasse Klasse 7 Lerneinheit Material Uncategorized

Pixel auf Abwegen

Categories
Fach Geographie Klasse Klasse 7 Lerneinheit Material

Flood Hazard

1. The Task

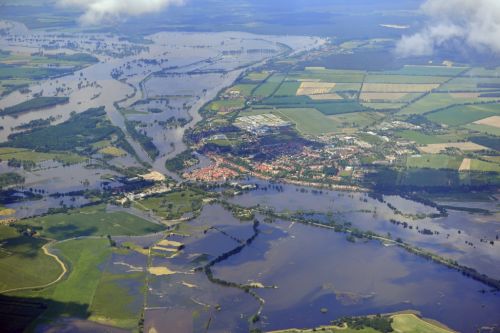
Elbehochwasser 2013
euroluftbild.de/Grahn, Hochwasser Elbe 2013-06-10CC BY-SA 3.0 DE
Hello!

You probably hear about floods in the media every year. It is a natural hazard that affects people who live on large rivers very directly. And if you want to build on the river, you should be aware of this danger. But how can you take floods into account when planning buildings? Let’s give it a try

The Letter

Read the Letter!

Use the marker in the analysis tool to mark the approximate location of the point described in the text. Then confirm briefly below to go to the next chapter.

Marker 

A task.
dsdffdsf

Eotools – hello from the saved content!

Tutorial: Einen Marker setzen

H 5 P Insert – hello from the saved content!

2. The DEM

The right data for the task

For a site analysis, information about the terrain height is important. These are made available to you as a so-called digital terrain model (DTM). The short animation shows you how such a data set is created with the help of a laser scanner.

Die Animation zeigt, wie ein DGM entsteht.

Such a DEM is the method of choice for analyzing the risk of flooding. So you should know how to use it.

Eotools – hello from the saved content!

DEM

A DEM from Bonn is loaded in the analysis tool. Examine it with the eyedropper tool . And answer the quiz.

You can use the eyedropper tool to read information in the image.

H 5 P Insert – hello from the saved content!

H 5 P Insert – hello from the saved content!

3. Hochwassergefahr

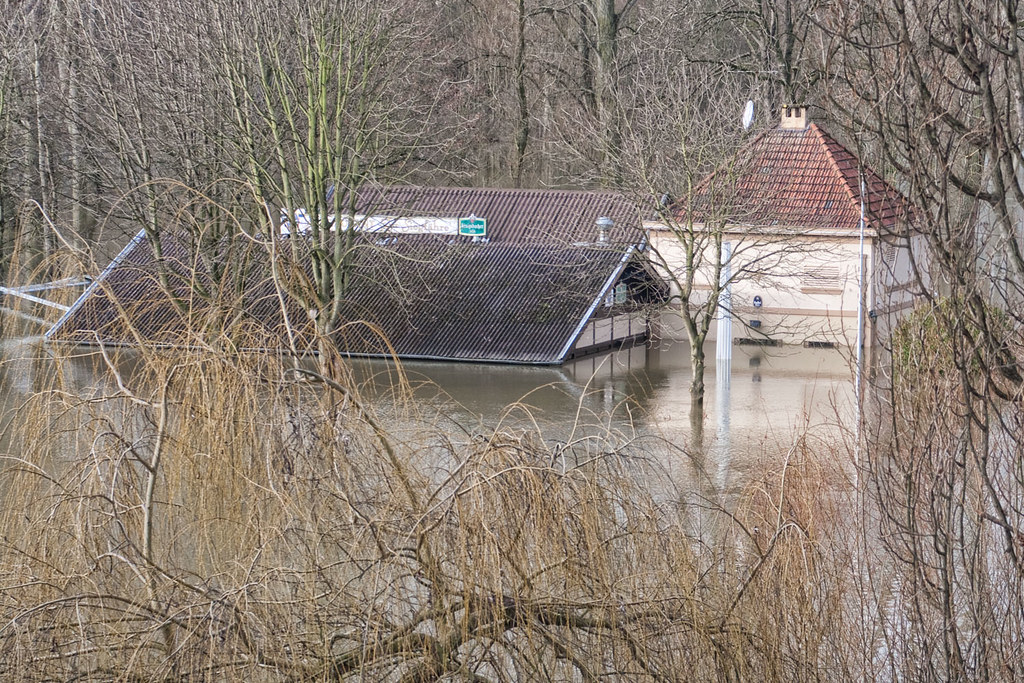
Hochwasser der Sieg bei Bonn 2011
Flood Scenarios

When planning new buildings near bodies of water, it is necessary to determine how often these can be affected by flooding. To either plan appropriate protective measures or, if flooding is a frequent problem, to choose a different location because the costs incurred do not justify the advantages of being close to the water.

Flood hazard maps, which show whether and how often an area is affected by flooding, help with the assessment.

Flood Hazard Maps

The Rhine value of 45m above sea level measured in the DGM corresponds to the mean water level.

But what happens when high water events exceed this mean water level?

Use the tool to create flood maps for a 2, 10 and 20 year flood!

  1.  >= frequently – Small flood + 6m
  2.  >= severe- Mean high tide +8 m
  3. >= extreme – Major flood +10 m

Eotools – hello from the saved content!

H 5 P Insert – hello from the saved content!

Flood risk and man-made factors

Floods and Humakind

Flooding is a natural phenomenon. Rivers overflow their banks seasonally, i.e. depending on seasonal changes. This happens as a result of long-lasting or sudden heavy precipitation. The soils, which actually absorb large amounts of water, are saturated and the rainwater flows directly into the rivers and their tributaries. The naturally meandering middle reaches of the rivers flood areas near the banks and create floodplain landscapes. This does not pose a threat to the flora and fauna of these regions. They are adapted to this process and in some cases even dependent on it. Flooding is also a constant companion in human history. Regions close to the shore are advantageous settlement areas in many respects and people deliberately exposed themselves to the floods. And the phenomenon of flooding became the danger of flooding for people.

Over the millennia, settlers grappled with the problem. But it is the human activities of the last 200 years that have had a significant impact on today’s flood situation. In the interaction you can find out which factors influence the risk of flooding.

Flooding in the uk 2020

Repository – hello from the saved content!

Categories
Fach Geographie Klasse Klasse 8 Lerneinheit Material Uncategorized

Tools

Erstes Kapitel

Ein Arbeitsauftrag

I’m baby heirloom tote bag lo-fi, thundercats flannel kinfolk plaid pug affogato occupy semiotics leggings. Biodiesel asymmetrical YOLO, ramps ethical fanny pack letterpress stumptown pop-up mixtape selvage intelligentsia austin. Echo park neutra air plant snackwave, disrupt shaman next level austin tacos biodiesel.

Böses Hochwasser

Eotools – hello from the saved content!

Voll im Blick. Das spektralste Spektrum

Repository – hello from the saved content!

H 5 P Insert – hello from the saved content!